Chennai Floods and Terrain Analysis
Nov. 4, 2017, 10:36 a.m.
Nov - Dec 2015 Chennai floods:
November - December 2015, Chennai was brought down to its knees by the downpour of rain.
Chennai received 1,049 mm (41.3 in) of rainfall in November,
the highest since November 1918 when 1,088 mm (42.8 in) of rainfall was recorded.
The flooding in Chennai was worsened by years of illegal development and inadequate levels of flood preparedness.
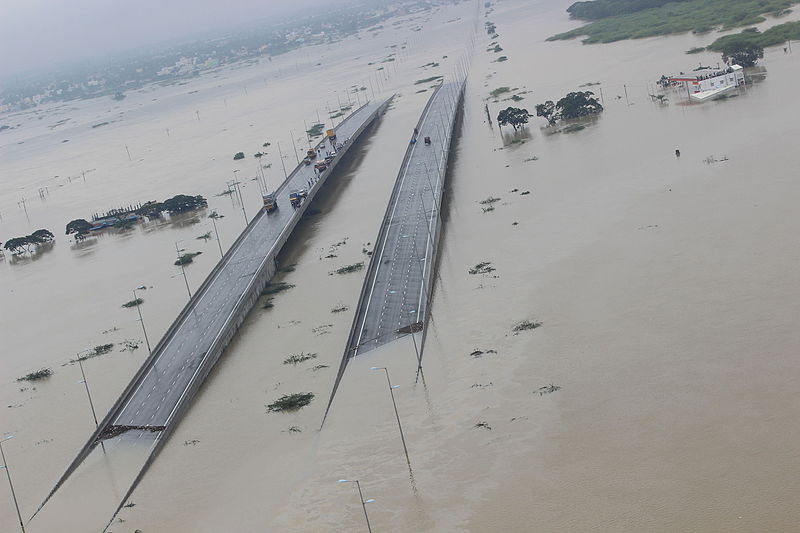
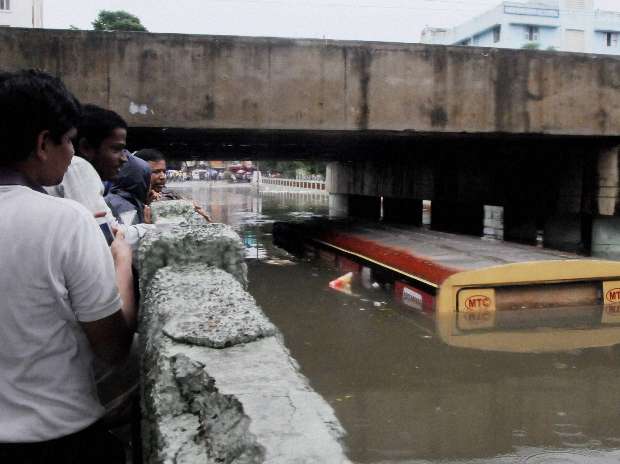
Below are few images of the 2015 Chennai floods.
These images remind us of our strength, and how we recovered from such a catastrophe.
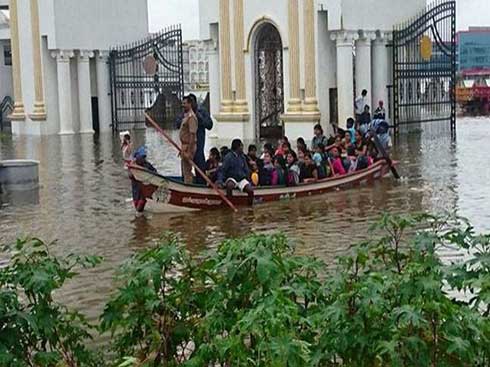
More than 500 people lost their lives[1] and over 18 lakh (1.8 million) were displaced.
With estimates of damages and losses ranging from nearly ₹200 billion (US$3 billion) to over ₹1 trillion (US$16 billion)
The flooding has been attributed to the 2014–16 El Niño event.
My experience:
I have never experienced anything of this magnitude and that left me in a state of complete shock.
The road to my house was completely flooded till my waist, making it impossible for me to stay at home.
Flood water was almost about to enter the ground floor of our apartment and
there was no access to clean water, no power and the cell phone towers were down.
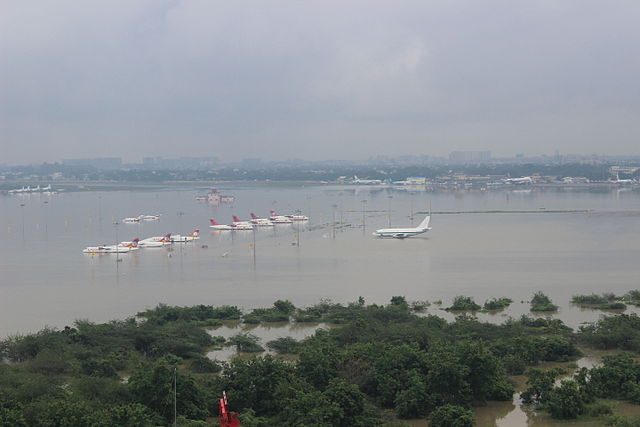
Airport was shut down, trains were cancelled, roads were flooded, Basically entire Chennai had collapsed.
All the hotels were either closed or completely booked. I had no place to stay.
My friends places were either flooded, or too risky to travel by road.
I can't thank enough to my then employer, Athenahealth, we stayed at the office for 3 days before I left for my home town.
Office was the only place with access to clean water, food, power, cellular signals and internet.
Well, I can just go on about my experience and how we got out of Chennai, but I'll leave it for some other post some other day.
The terrain analysis:
This experience left me thinking, of how can one be more prepared if such event were to happen again.
One of the most crucial decisions within our personal capacity is the place we choose to stay.
If you are looking to buy an apartment or just renting a place, please do a research on the elevation of the region and also the connecting road.
If you stay in an elevated area, you are less likely to experience flood like situation.
Low-lying region which are completely enclosed by high elevated region than itself, will be at a higher risk of flooding,
because the water will have nowhere else to flow, other than seeping into the ground.
As the rate of seeping is very low, unless we have a good drainage system, all these areas are going to be flooded.
I looked up on the internet for the elevation map of Chennai but I didn't really find what I was looking for,
so here is the one that I plotted.
I must say I am surprised by the result. Everything is evident now. How did we not see this coming?
With better analysis of the region and urban planning this situation could be easily avoided, or at least minimized.
Map details:
The map shows the elevation contours with labeled elevation in meters
The intensity of the colour depends on the elevation of the region, blue being low-lying region and red being high-elevated region
Spatial Resolution: 3 arc-seconds (~90 meters)
I hope the Map gives you an idea of the elevation and low-lying regions in and around Chennai and help you make an informed decision in choosing a place to stay.
You can view it in the embedded map below or open it in a new tab MAP: Chennai Terrain Analysis
(The map might load really slow or you might have to refresh it 2 3 times as it is hosted on a free Web-GIS platform)
Below are few screenshots of the region I know were flooded during 2015 and it is very evident why.
Click on the image to enlarge the picture in a new window.
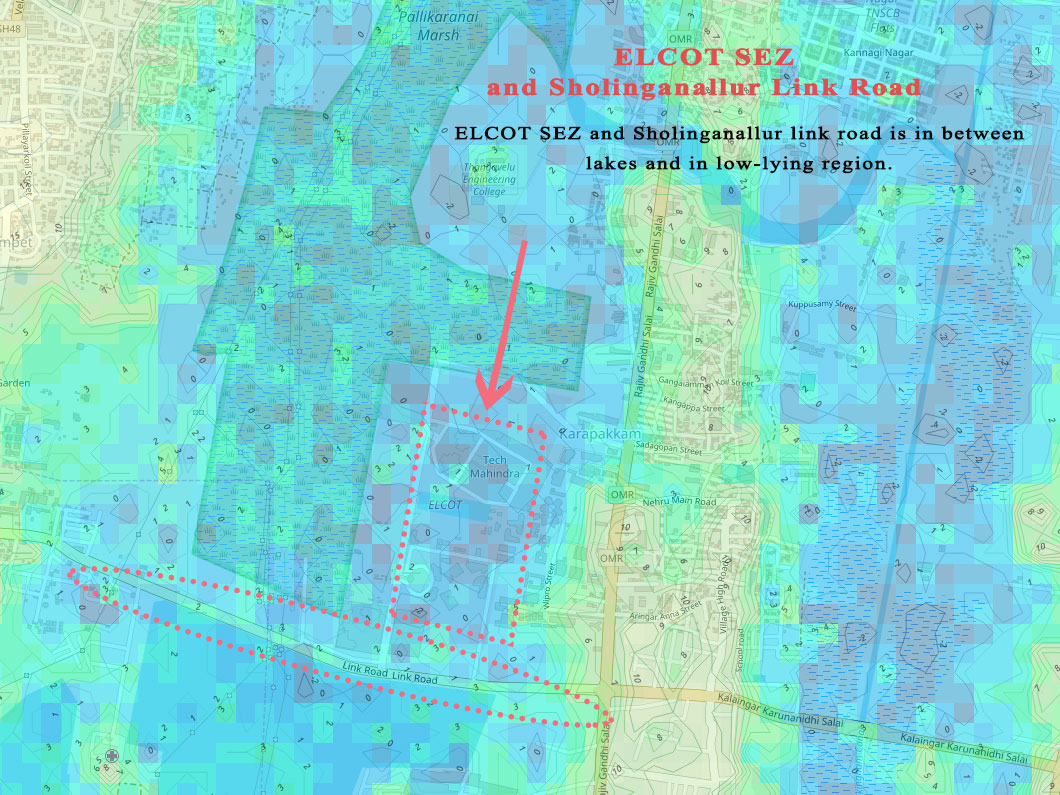
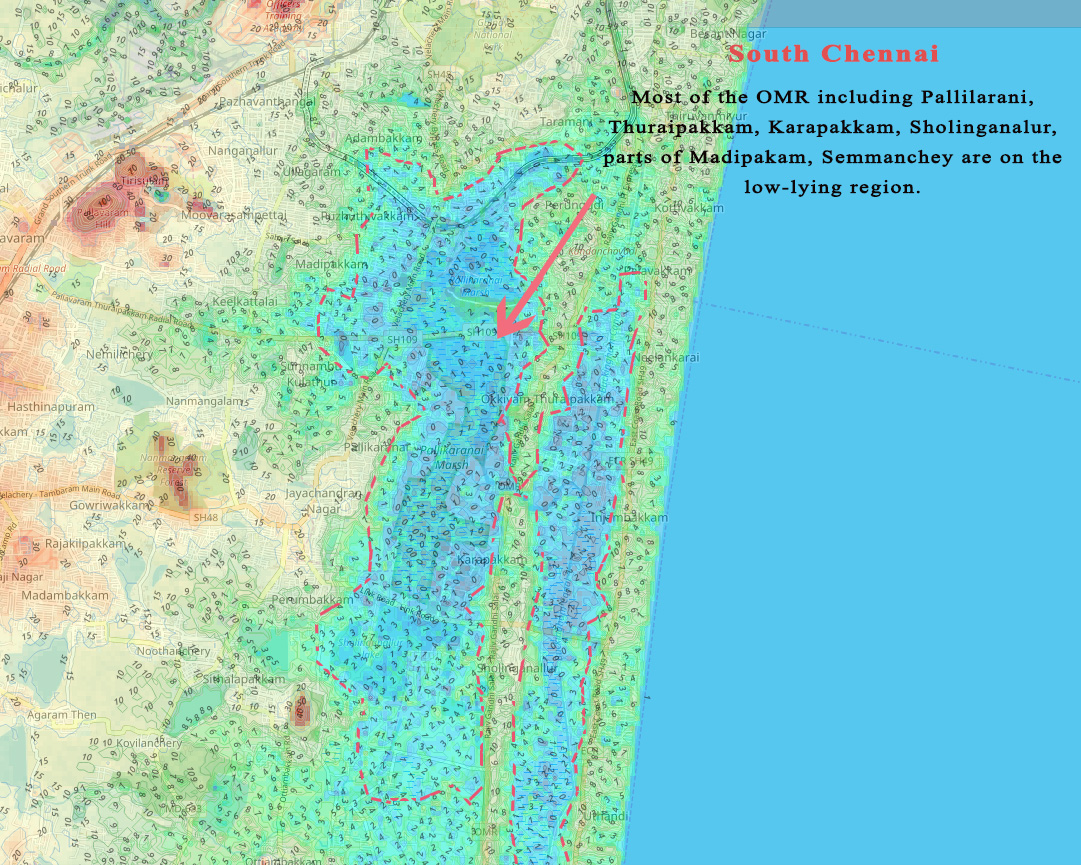
Sholinganallur region:
Entire ELCOT SEZ in Sholinganallur and the link road are on a low-lying region.
As expected these regions were flooded during the 2015 floods
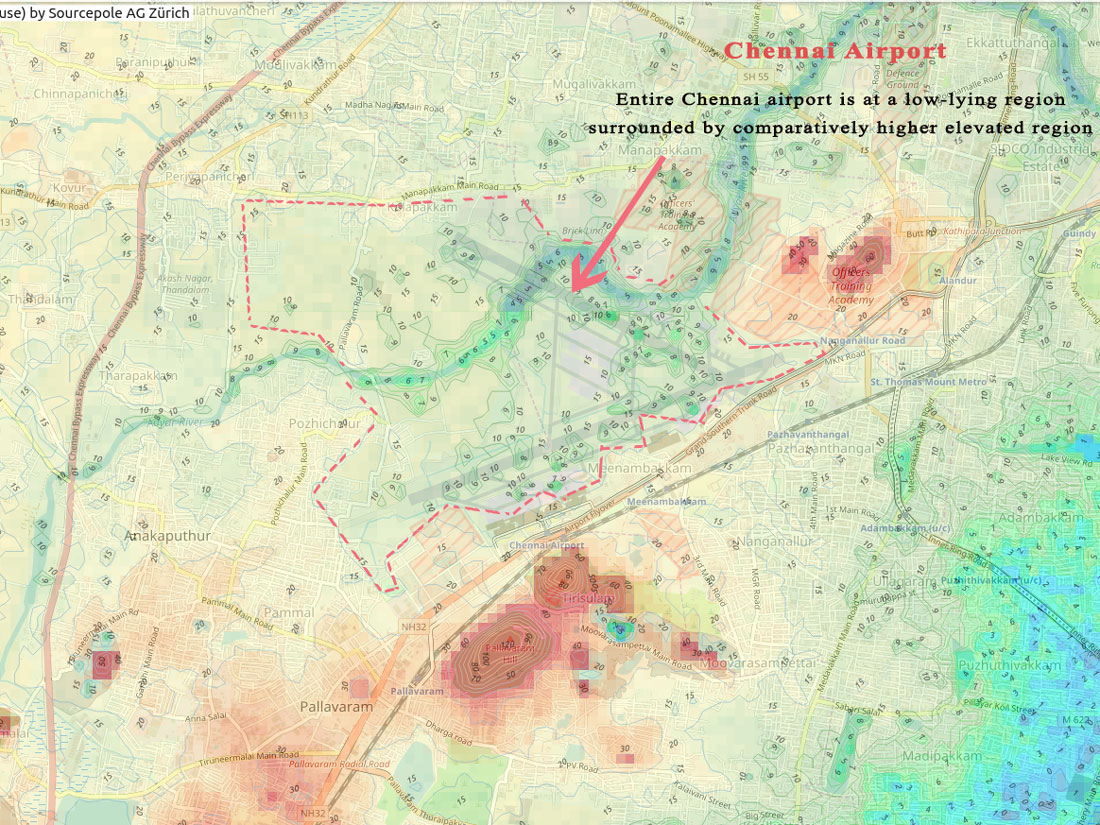
Airport region:
You can see the Chennai Airport is surrounded by high-elevated region.
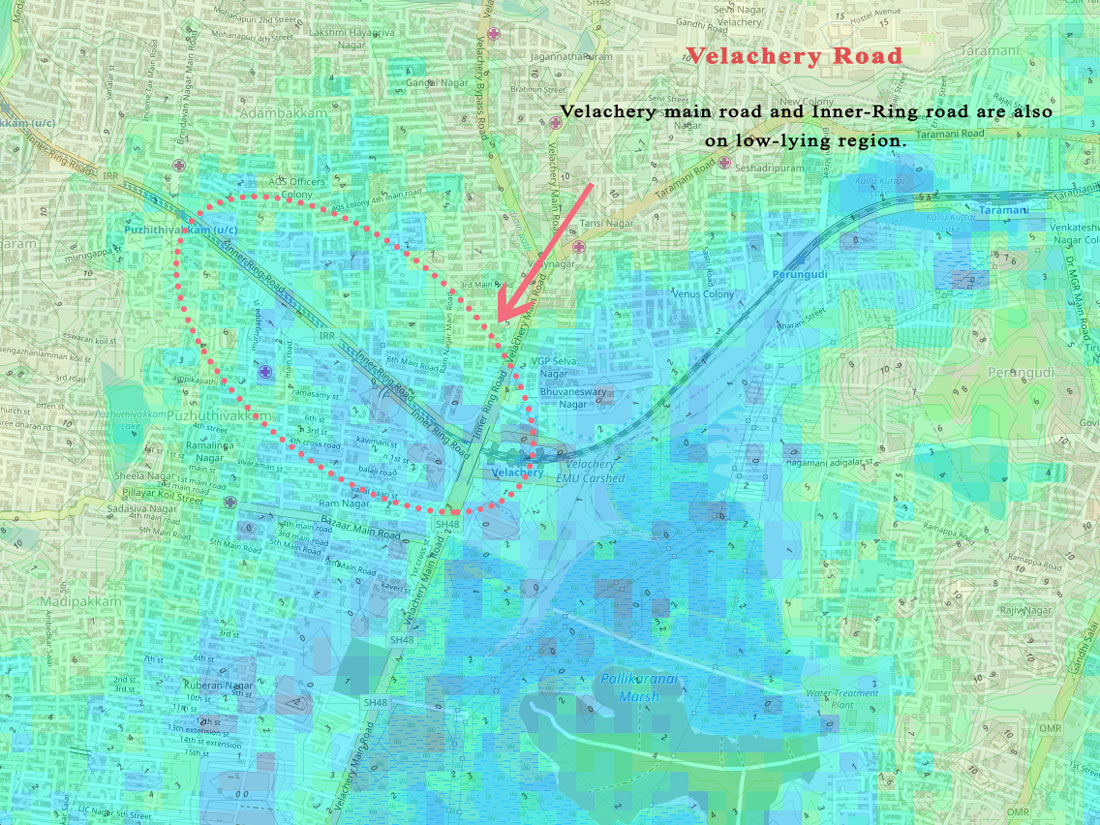
Velachery region:
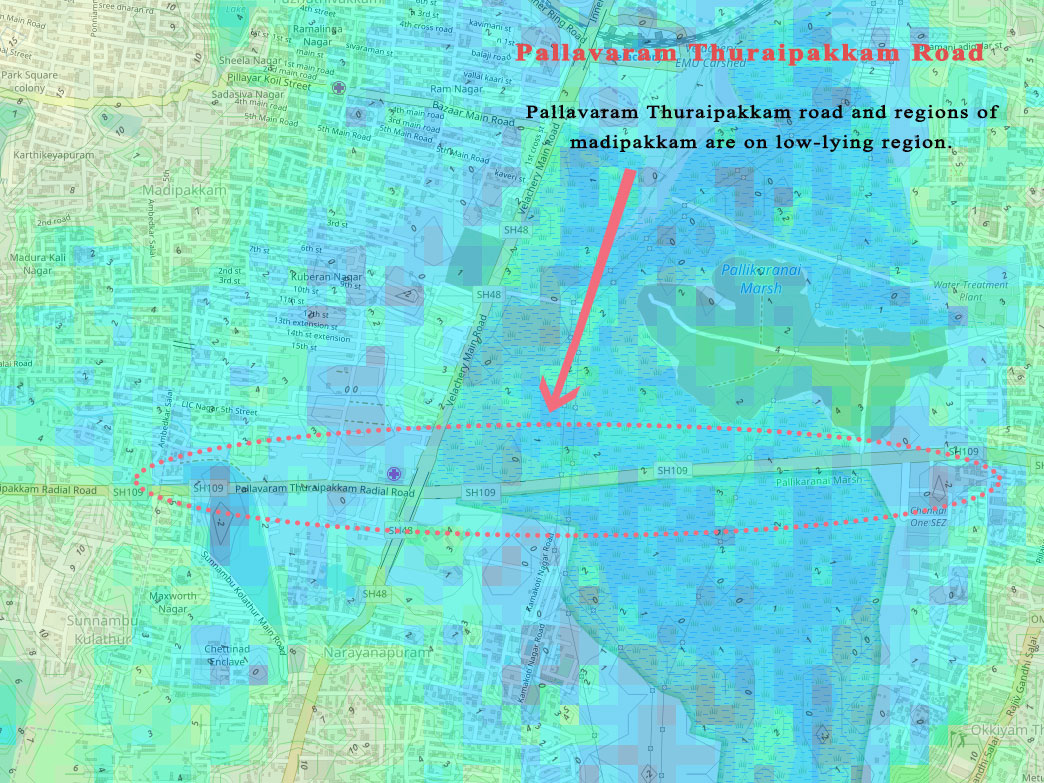
Madipakkam region:
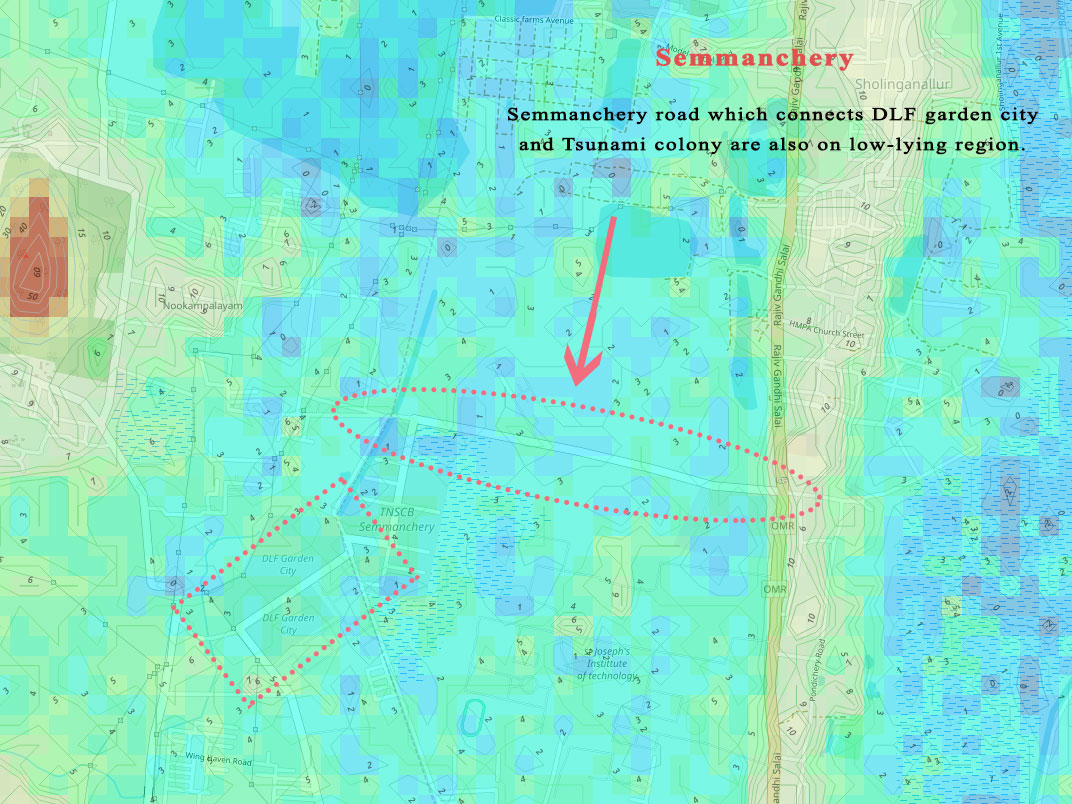
Semmanchery region:
The road to DLF Garden city and the Tsunami colony are on low-lying region.
In fact most of the OMR and surrounding regions are low-lying:
Embed map
Note:
I'm a computer science graduate and my knowledge of Topography is limited.
There are several other factors that can affect the flood situation.
Please do let me know if you think you can help improve this.
You can drop me an email at tarunpaul@cognious.com
I only intend to help you make an informed decision. Please do a thorough research before making any decision.
[1] - Wikipedia: 2015_South_Indian_floods
Elevation Data Source:
SRTM by NASA and NGA
CartoDEM by ISRO
Libraries and Tools:
QGIS - Free and Open GIS software
QGIS Cloud - Web-GIS platform for publishing maps
GDAL - Python Geospatial Data Abstraction Library
numpy, matplotlib, pyqgis
Elevation Data Source:
SRTM by NASA and NGA
CartoDEM by ISRO
Libraries and Tools:
QGIS - Free and Open GIS software
QGIS Cloud - Web-GIS platform for publishing maps
GDAL - Python Geospatial Data Abstraction Library
numpy, matplotlib, pyqgis
 Tarun Paul